Fields of application of POST-PROC 2

Data evaluation of simulation results
time-dependent and dynamic data

Flexible design of diagrams
Strict separation of data and layout

Export of raster and vector graphics
Data export including interpolation function

Integrated calculation models
Assessment of mold growth
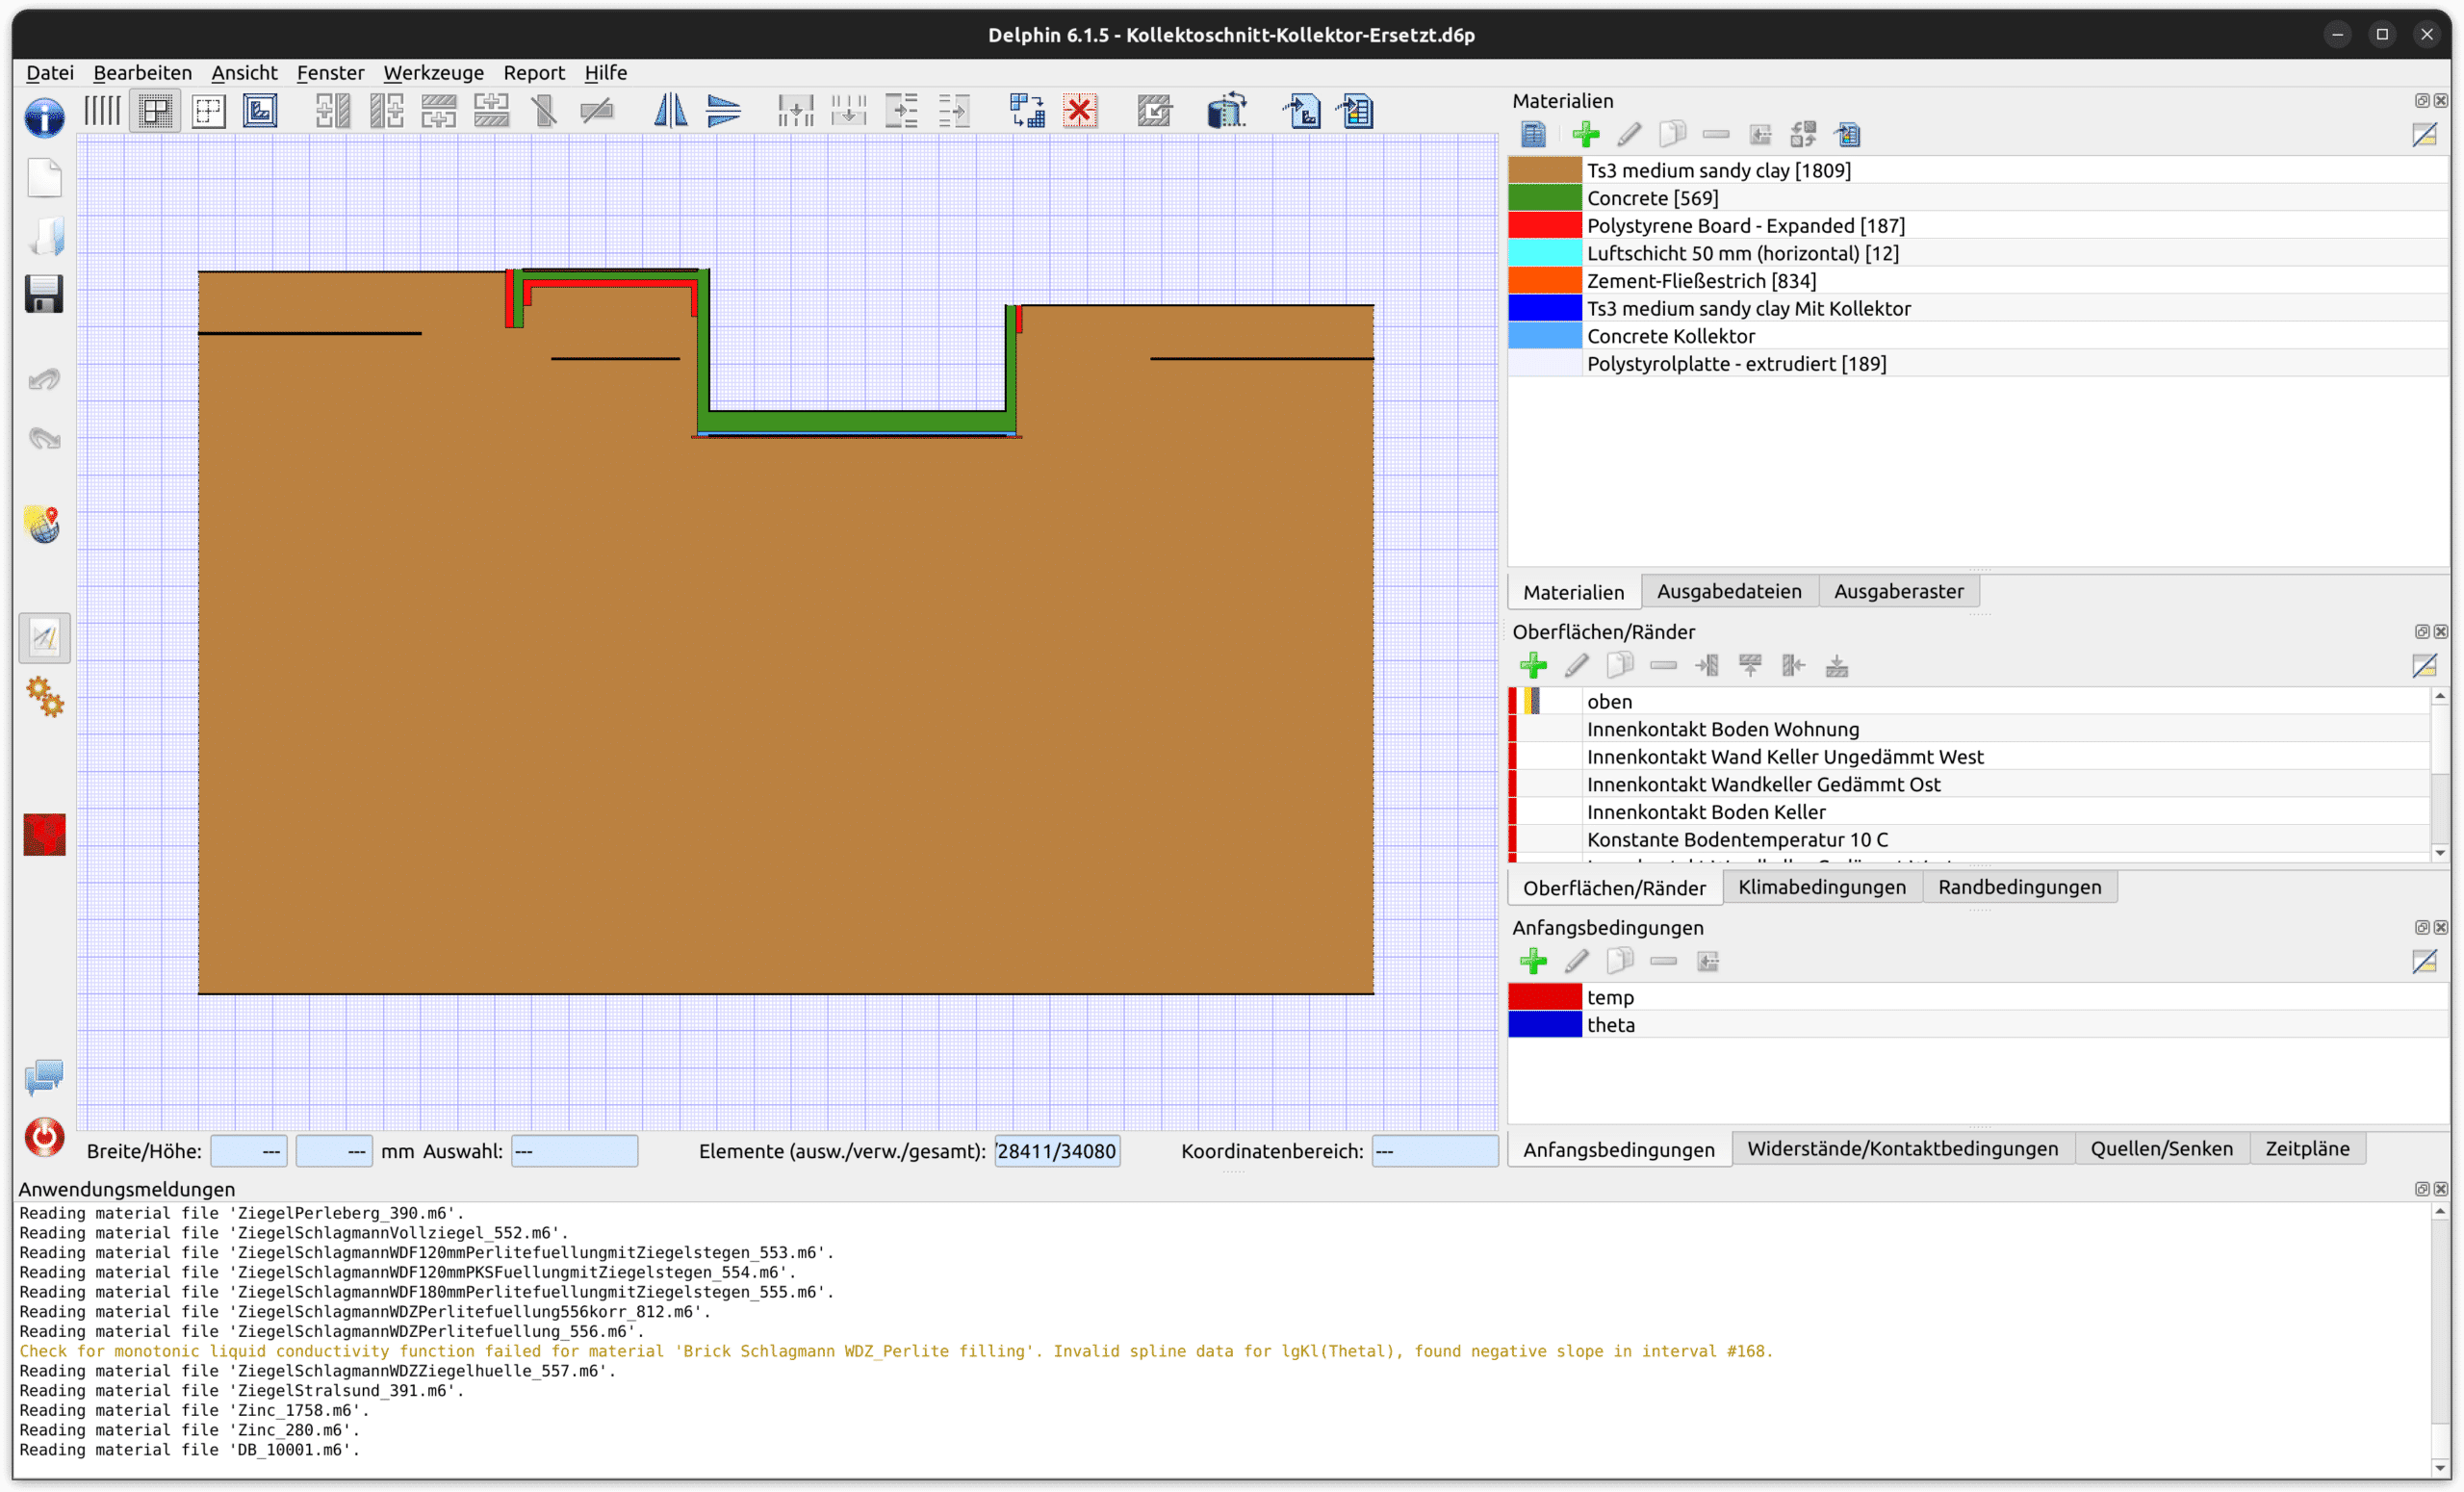
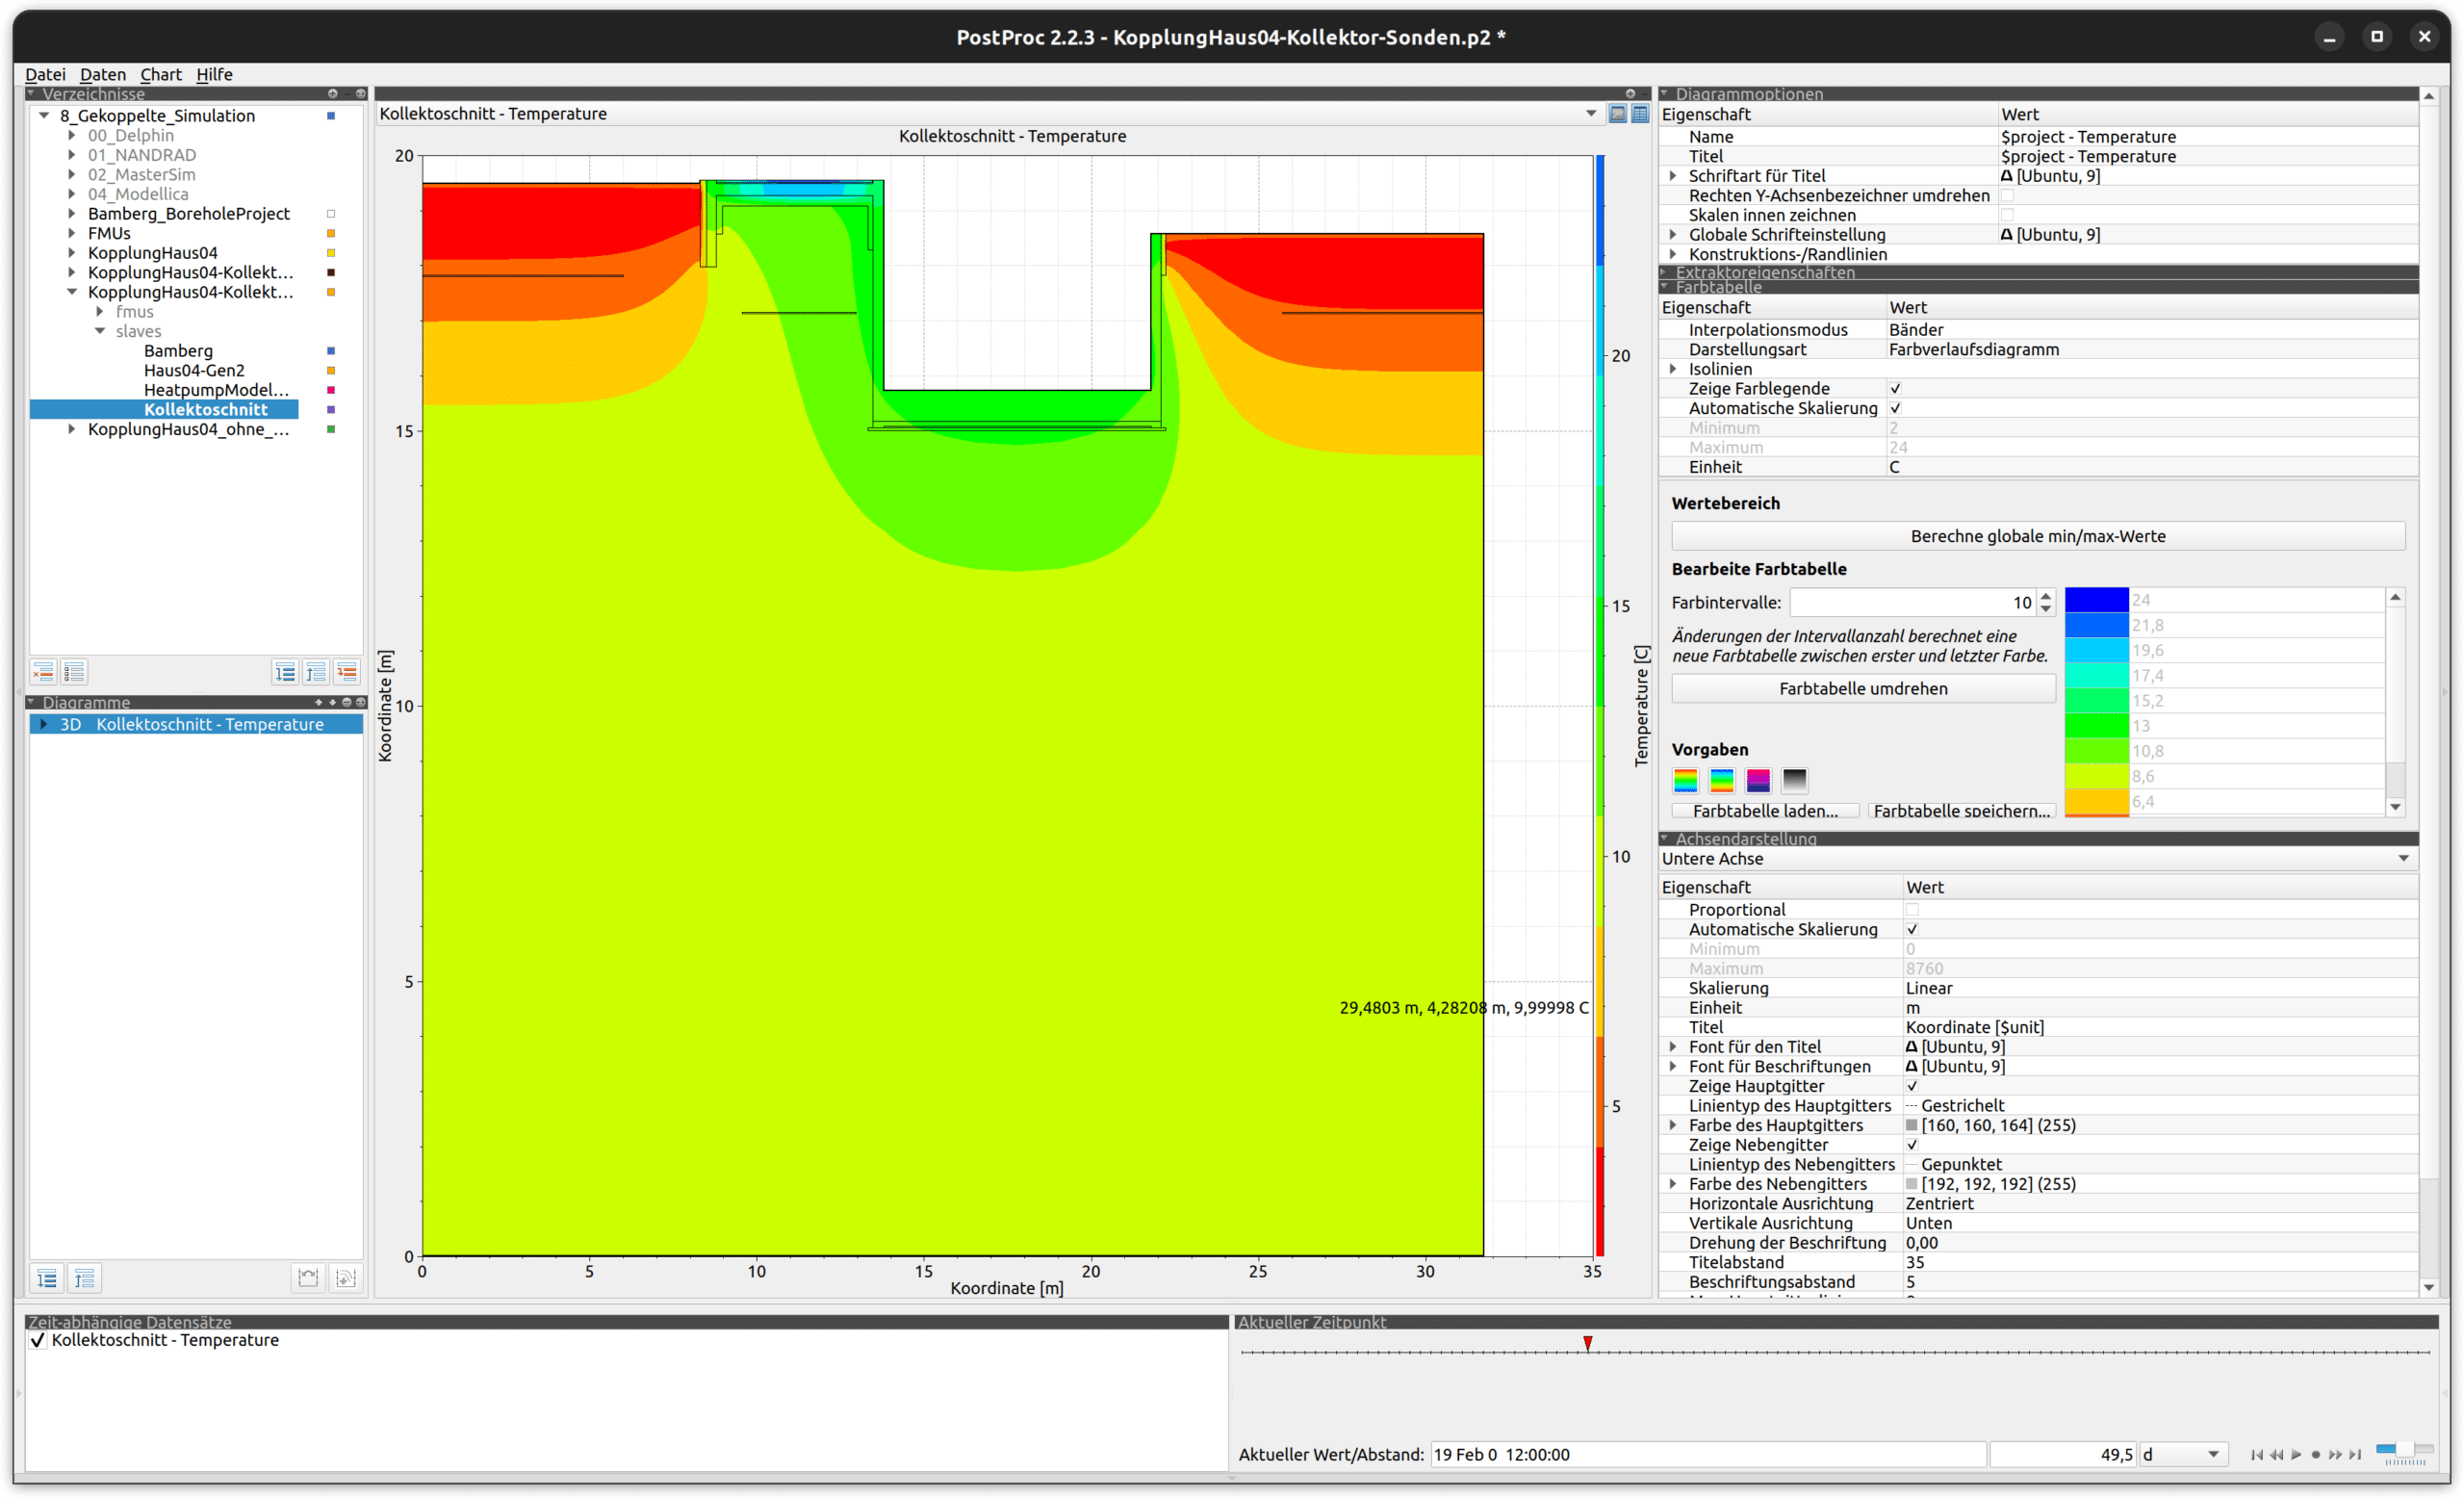
Screenshots POST-PROC 2
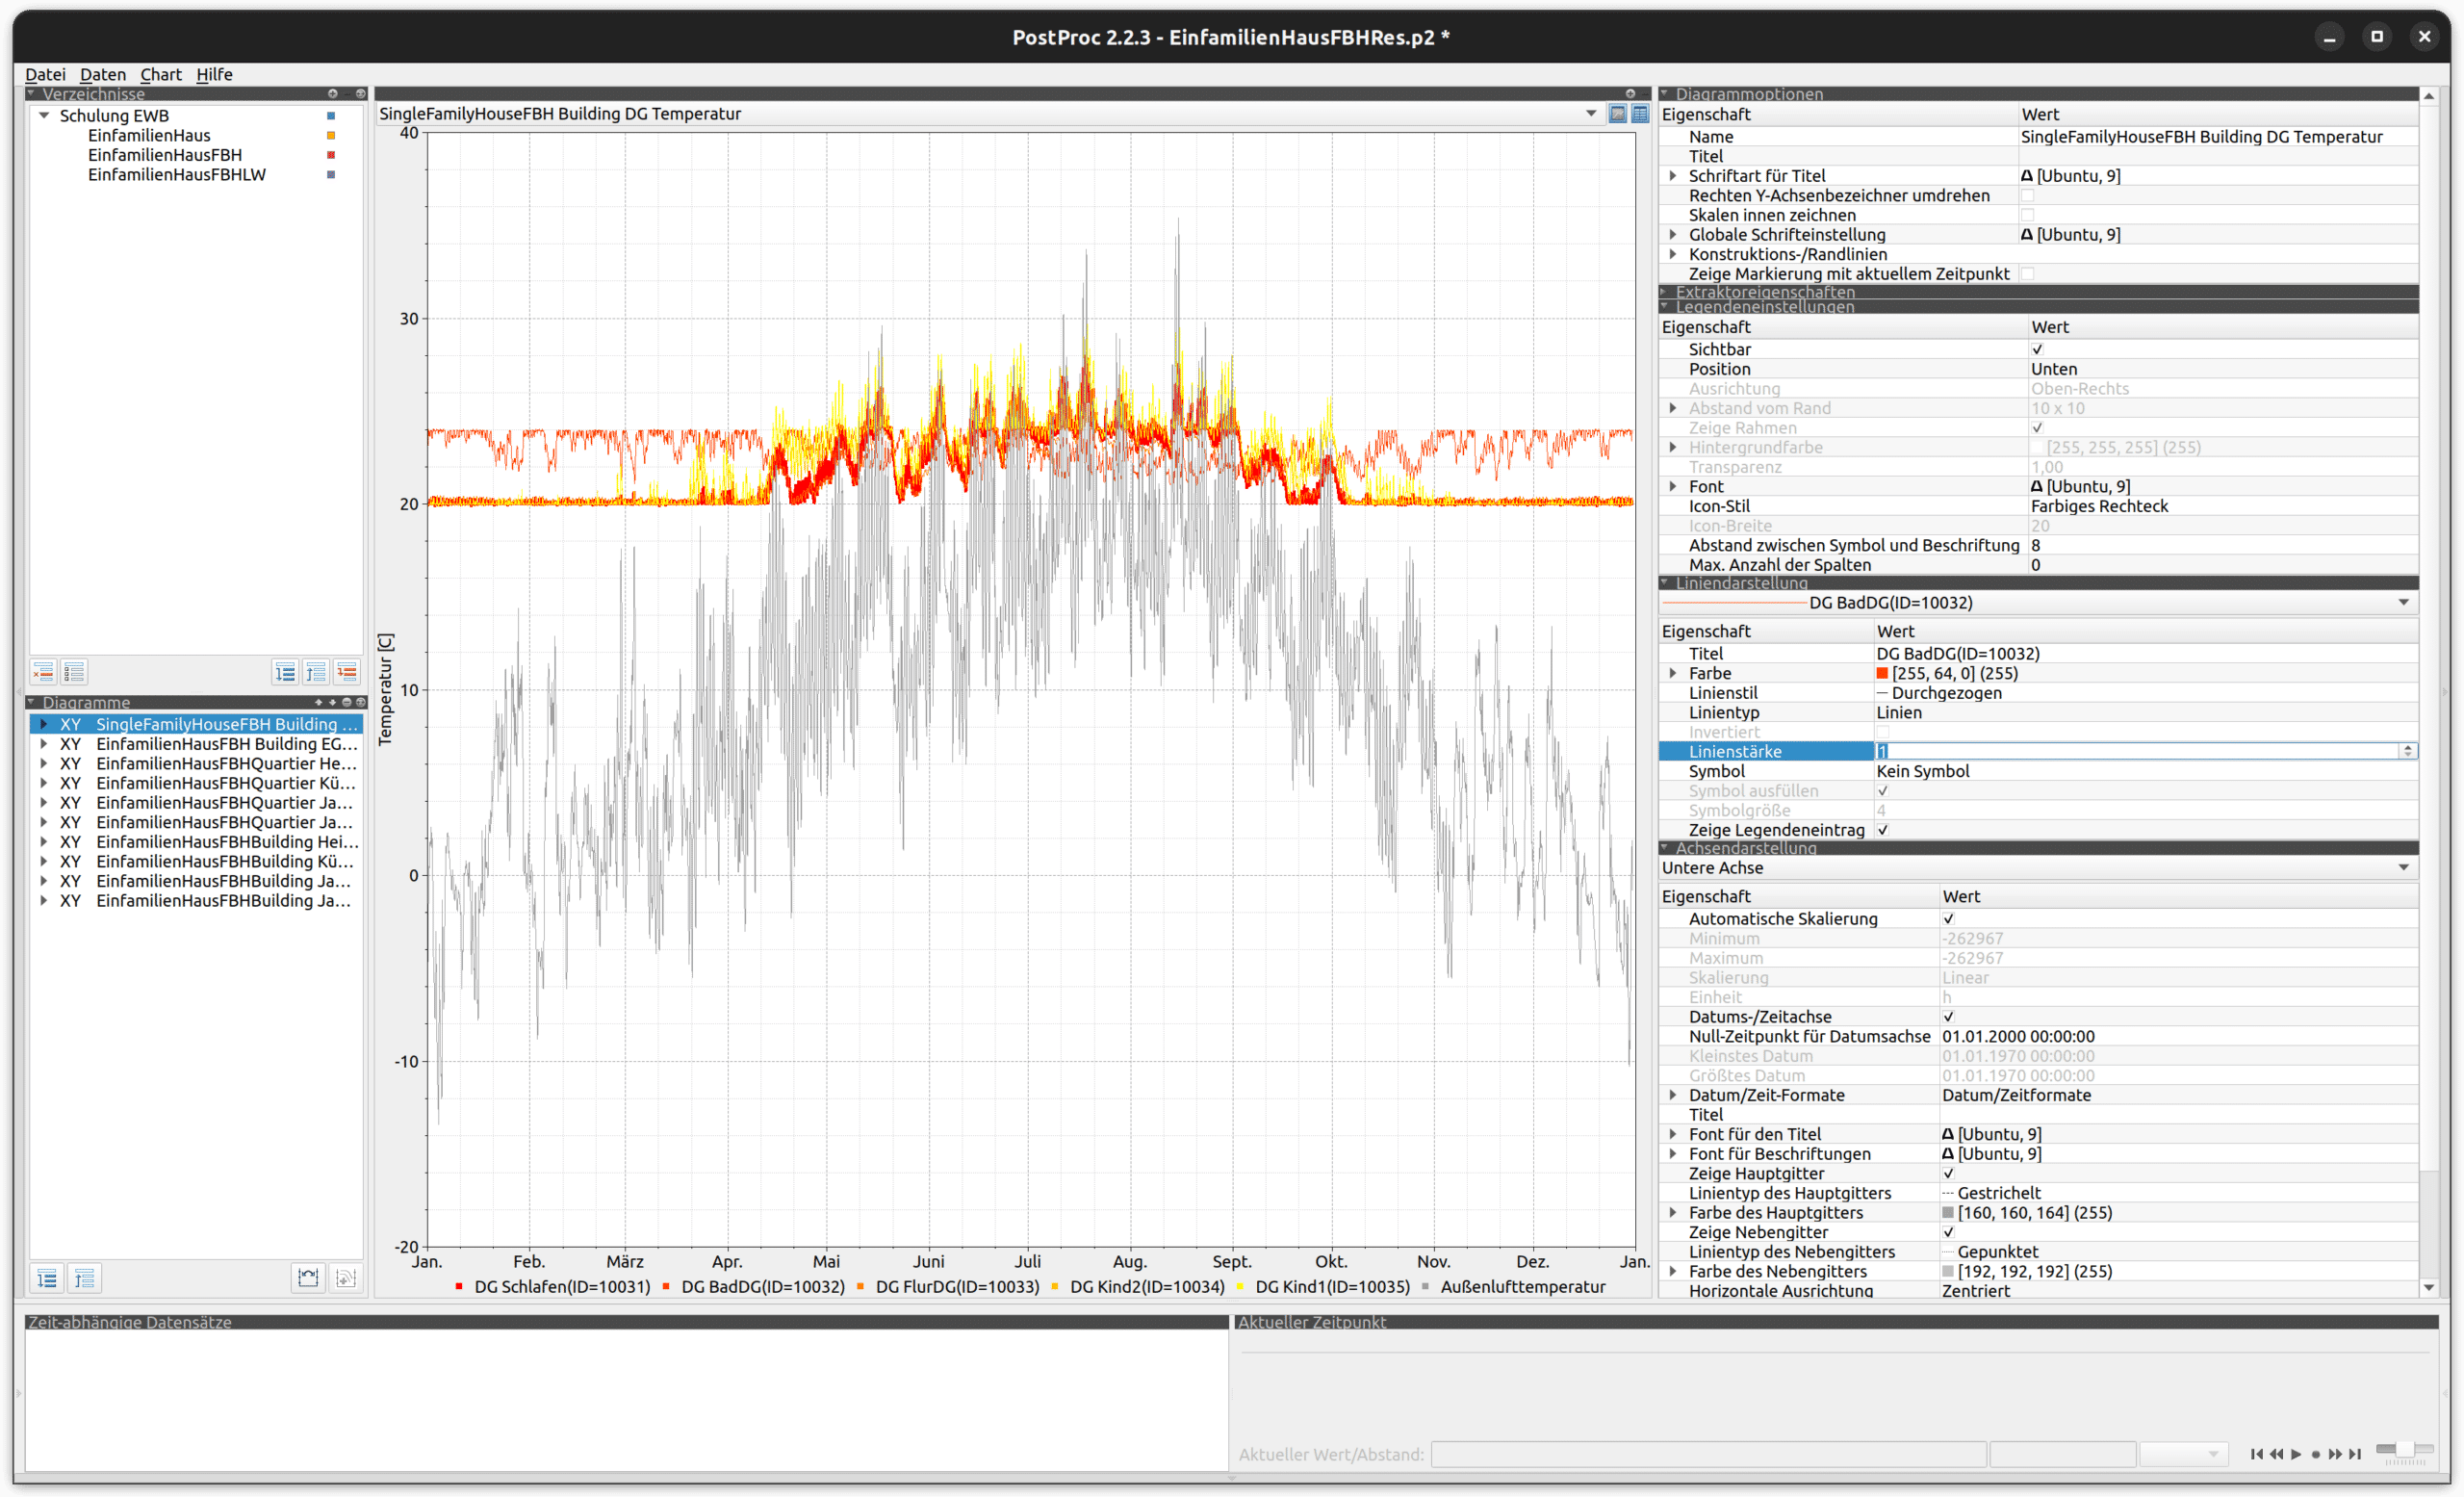
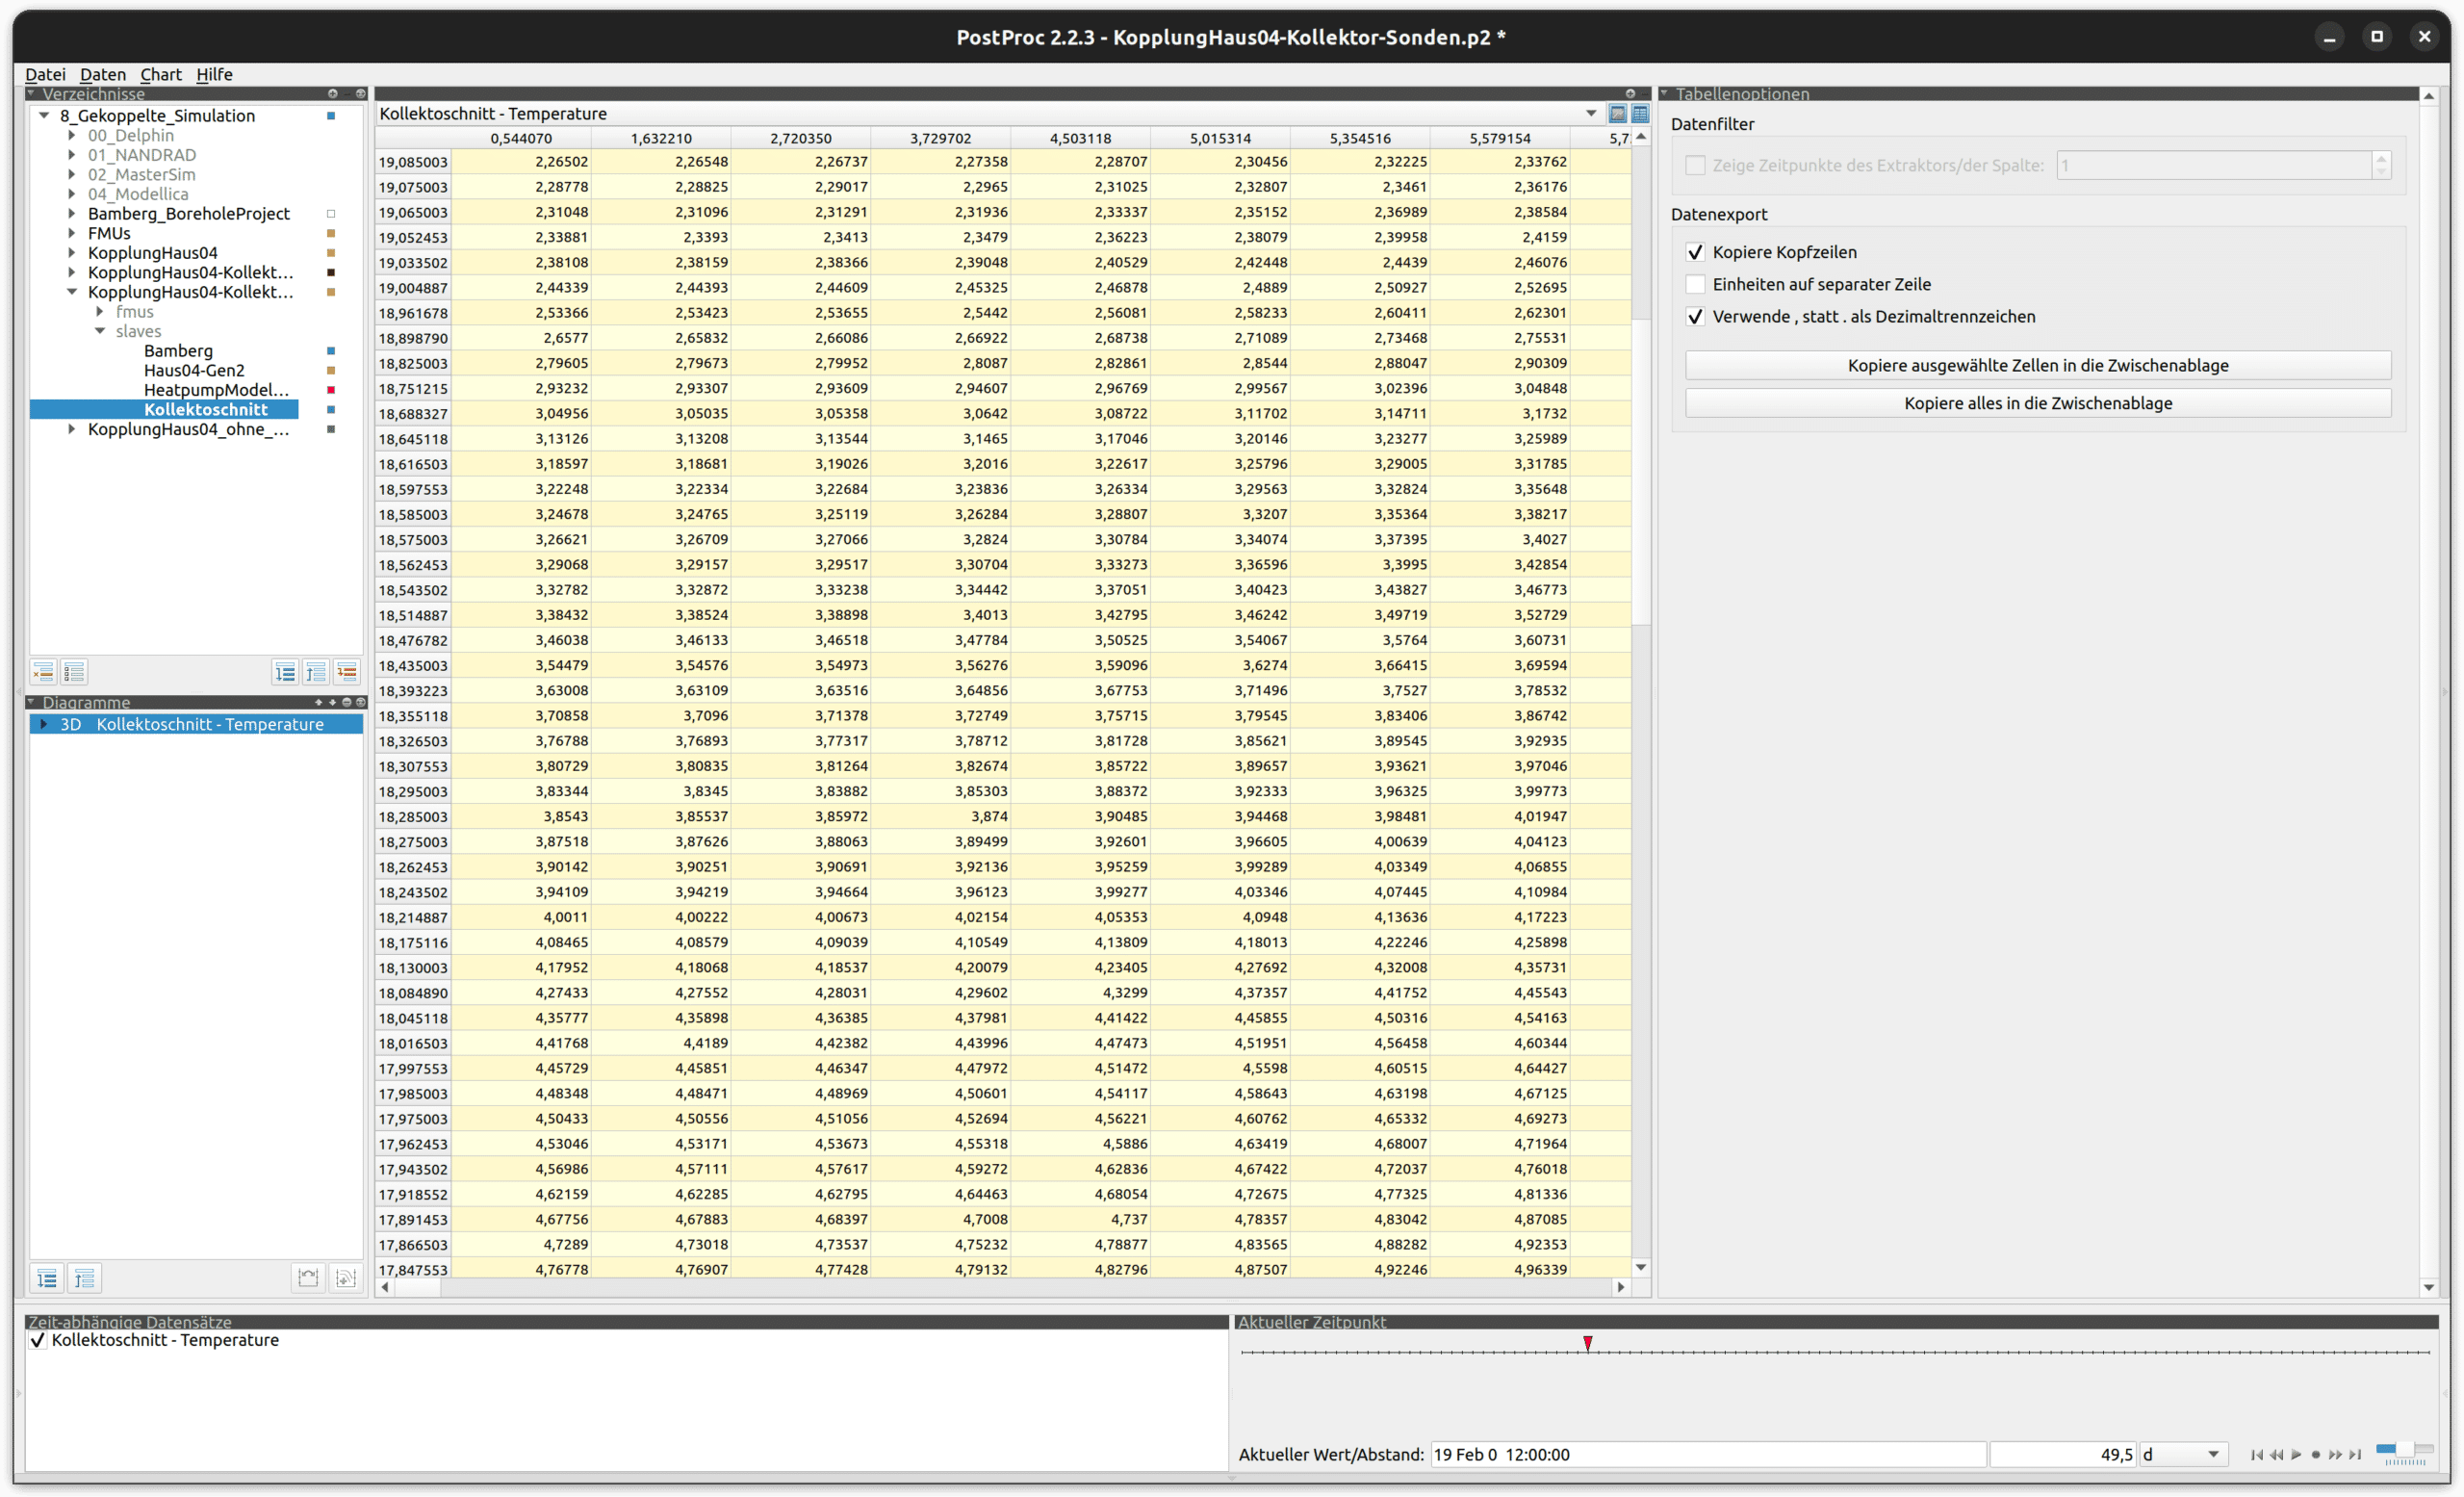
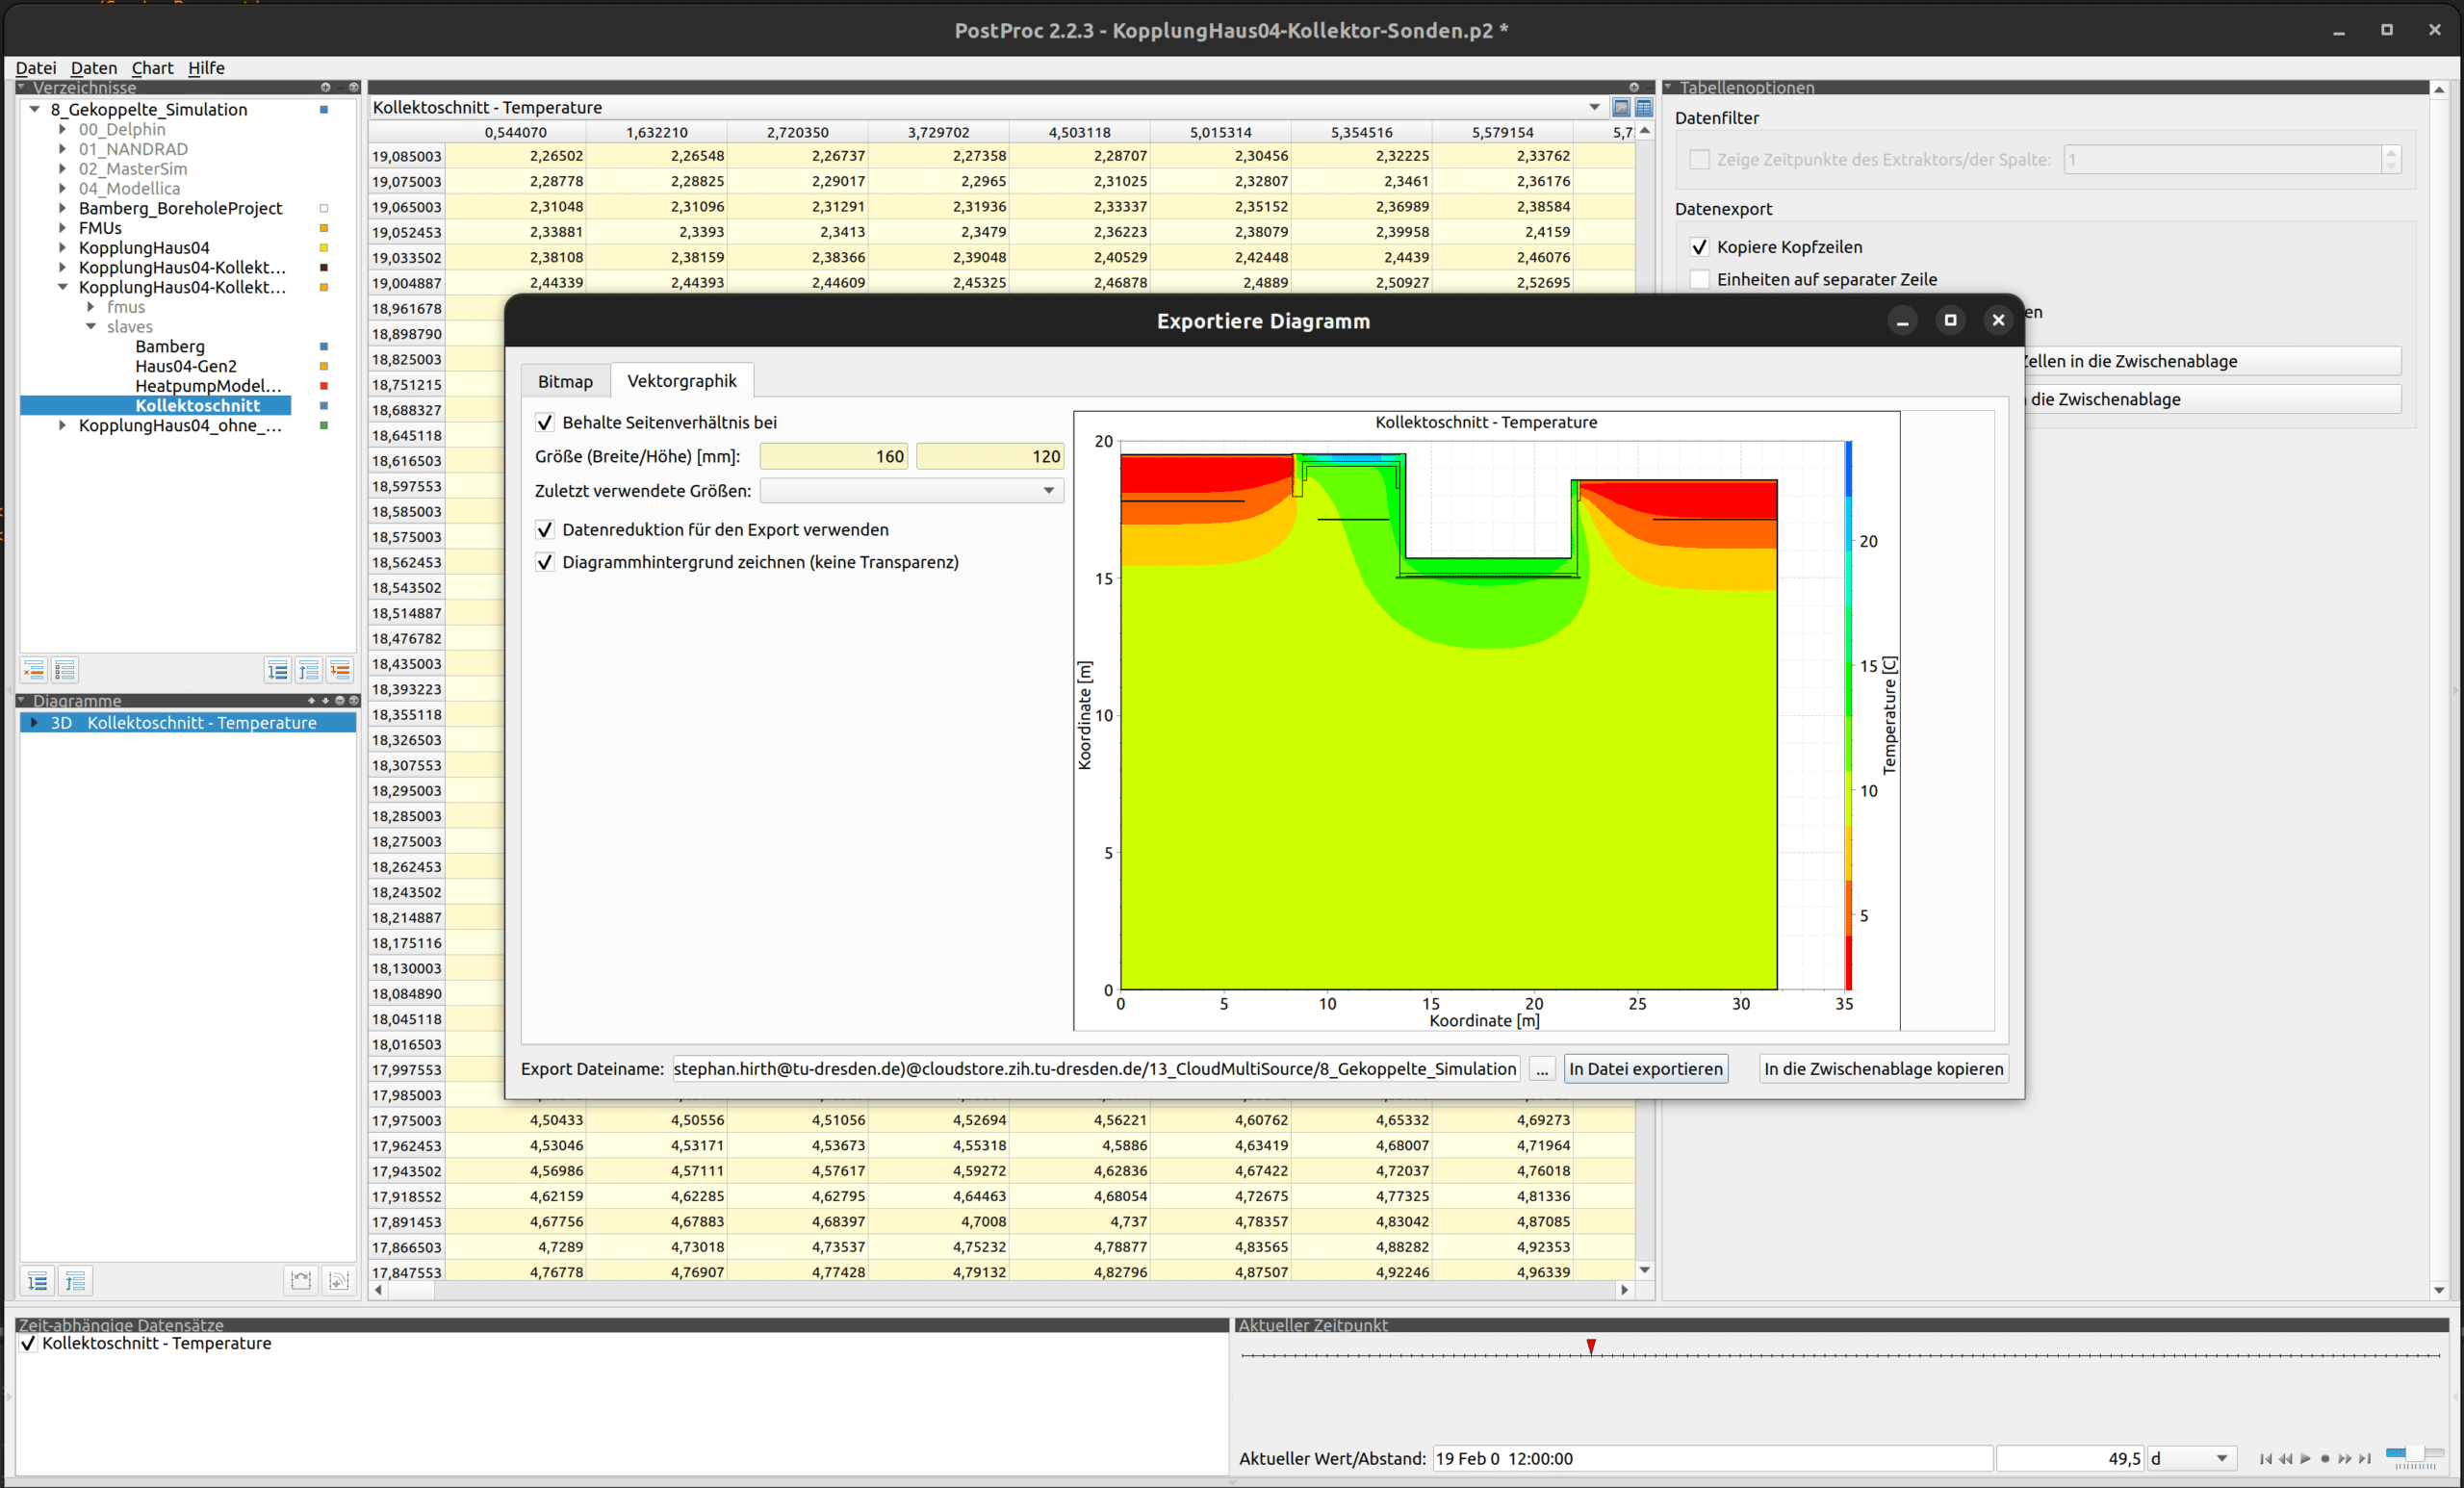
POST-PROC 2 function overview
For use in planning/engineering practice

- Analytical post-processing of time-dependent and dynamic data (series).
- Developed for simulation programs such as NANDRAD, DELPHIN, THERAKLES or MASTERSIM, POST-PROC 2 also offers the analysis of related simulation programs.
- Import data of different formats
- Data display, zooming, unit conversion, linear/log scales for the axes, …
- Flexible and fast chart formatting and export to vector or bitmap graphics (with precise size and scale settings for correct print display)
- Calculation of mold growth criteria
- Data analysis and transformation with models
- Live view of results, during simulation runtime
- Analysis of measured values and experimental data
Trennung von Daten & Visualisierung

- A key feature of POST-PROC 2 is the separation of data and its visualization. It allows updating data/files and thus also a live view of the calculation results.
- Different diagram configurations are saved in one session. The session file is an XML file and can be edited in the text editor.
- Ability to duplicate diagram configurations in the text editor or by simple search-and-replace. A script-based creation or adaptation of the session files is of course possible. Even in a running session POST-PROC 2 detects the changes and gives a hint message.
- The source data is not stored in the session file, but referenced in external files.
Static and dynamic visualization of data fields and rows


- Different chart types implemented
- Principle separation in 2D and 3D diagrams.
- In time-value diagrams, the X-axis is assigned as the time axis, data series are assigned to the Y-axis. Two different physical units are possible.
- 3D data (i.e. time-coordinate value) can also be displayed in classic 2D graphs, where the X-axis maps the coordinate, and the values of a specific point in time are displayed.
- In 3D diagrams, the third dimension is represented as a color or isoline.
- Furthermore, vector field outputs (e.g. of flow fields) are possible.
- In POST-PROC 2, several diagrams can be displayed simultaneously, whereby it is possible to change the time in several or all diagrams at the same time in the case of time-animated diagrams. In this way, interrelated physical effects can be analyzed well.
Detailed online help
- The extensive range of functions and examples are documented in an online manual. Furthermore, a print version of the manual is available for download.
Download
| File | Size | Type | Last Modified | Download |
|---|---|---|---|---|
| POSTPROC2 Version 2.3.0 - Linux 64-Bit | 2.09 MB | 7Z | 2023/02/05 | Download |
| POSTPROC2 Version 2.3.0 - Windows 64-Bit | 10.01 MB | EXE | 2023/02/05 | Download |
| POSTPROC2 Version 2.2.0 - Windows 64-Bit - portable version | 9.11 MB | 7Z | 2023/02/05 | Download |
| POSTPROC2 Version 2.2.3 - Linux 64-Bit | 2.36 MB | 7Z | 2023/01/24 | Download |
| POSTPROC2 Version 2.2.3 - MacOS 64-Bit | 14.52 MB | DMG | 2023/01/24 | Download |
| POSTPROC2 Version 2.2.3 - Windows 64-Bit | 9.83 MB | EXE | 2023/01/24 | Download |
| POSTPROC2 Version 2.2.3 - Windows 32-Bit | 7.73 MB | EXE | 2023/01/24 | Download |

